Why is analyzing your rehab center’s website important?
Google Analytics provides a tremendous amount of information about your website. With more internet users each day, finding ways to improve your website is essential to continue the growth of your rehab center online. Using analytics data will help guide your decisions and allow you to track the impact of your website changes.
5 metrics to track with Google Analytics
Google Analytics has many different metrics you can track. We would like to focus on 5 key metrics that will help you use Google Analytics to find areas of opportunity for your rehab center’s website.
1. Analyze traffic sources
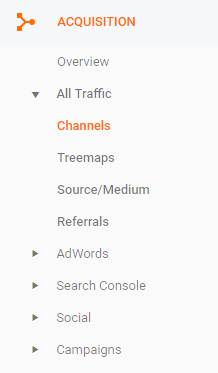
Under the acquisition tab in Google Analytics, you will find an overview of all traffic. In the all traffic view you can look at traffic broken down by channels. Some channels you will see include:
- Organic Search — this includes the search engines like Google, Yahoo and Bing
- Paid Search — any traffic source that comes as a result of any paid ad efforts
- Referral —traffic referred from another website to your own
- Direct — traffic when a user visits your website directly or via a bookmark
- Email — any traffic that comes from emails you have sent to clients
- Display — traffic from any ads you ran through the display network
- Social — any traffic source that comes from a social media network
Tracking where your traffic is coming from can help you understand what is working and areas of opportunity for you to drive more traffic.
 2. Look at bounce rates
Google Analytics allows you to see the bounce rate for pages on your rehab center’s website. Bounce rate is a percentage that shows how many people left your page after only viewing one page. A high bounce rate indicates that your content may not be relevant to your visitors.
Looking at which pages have high bounce rates will show you which pages you may need to edit. In comparison, looking at pages with low bounce rates will help you see which type of content your visitors find most relevant and engaging. Knowing what pages your viewers spend longer reading will help you develop additional content that is similar to the content that is performing well.
3. Understand your audience
To create content for the right audience, you need to understand who that audience is.
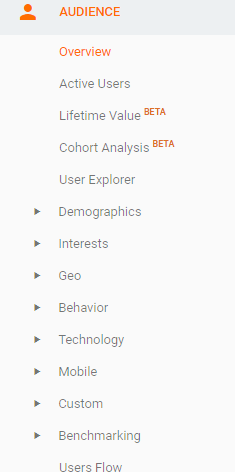
Google Analytics provides an audience tab that describes key metrics about your audience. You can learn demographics like gender and age, where your viewers are from, and various interests they have. You can even see what device and web browser your viewers are using to read your content.

When you use analytics to understand your audience you can ensure your content is targeted to that audience and relevant to their needs.
4. Site diagnostics
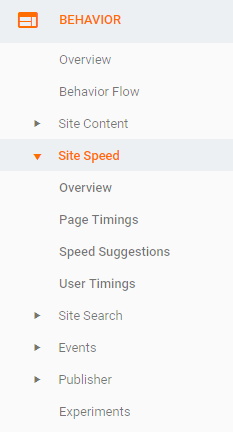
Google Analytics provides information about your site speed in the behavior tab. Since you want your website to be user-friendly and work efficiently for visitors, this is a great location to discover pages that are performing poorly due to technical issues.

The speed at which a page loads directly impacts user experience. Information like site speed, average redirection time and average page download time are all available in Google Analytics.
This information can help you understand if there are pages on your site that need to be fixed. For example, looking at an overview of site speed can show you days where your site may have doubled in load times. Knowing which days your site speed had an issue can help identify what happened on that date to cause the delay.
5. Goal tracking
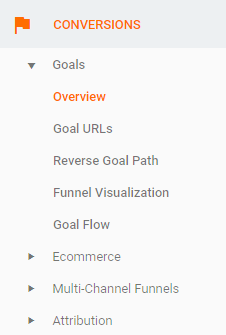
Goal tracking in Google Analytics allows you to track when visitors perform a specific task on your rehab center’s website.
For example, you could establish a goal to track whenever someone enters their email address, downloads a guide from your website, or enters information on a “contact us” form. You can establish the value for a completed goal or lead and track the value that each lead is generating.
Tracking a goal allows you to get a better overview of the actions that visitors are taking on your website. If you are tracking the value of a lead, you can get an idea of how much you are making per lead.

Do you use Google Analytics to improve your rehab center’s website?
Have you used Google Analytics to track your website? We would love to know what key metrics are your favorite to analyze. Let us know in the comments below!


 WebFX, Inc.
1705 N. Front St.
Harrisburg, PA 17102