How to Find Traffic of a Website

One of the most basic, though important, website metrics to track is the traffic coming into the site. While it’s important to track metrics like goal conversions and revenue, most metrics are directly related to overall website traffic. When a website is getting a lot of traffic, other metrics tend to increase. On the other hand, when there are very few visitors to a website, metrics tend to dwindle.

It’s also important to understand where website traffic is coming from so you know if your marketing efforts are working. If you’re putting a lot of money into email marketing, but you don’t know how many people actually visit your site as a result of opening an email, it’s hard to measure the success of your campaign. Understanding the sources of your website traffic will tell you which marketing campaigns are working and which ones are not.

Additionally, tracking website traffic can help you understand who your audience is. You can look at things like demographics of your website visitors, geographic locations, and even the type of device your visitors are using to find your site.


traffic channel report


Not only can you track web traffic to your site as a whole, but you can track traffic to specific pages or sections of your site. Tracking specific pages can help you understand how well they are performing and if they’re contributing to the overall traffic. When you add new pages and blog posts to your site, you can keep an eye on their performance by tracking website traffic. One simple metric gives you a world of insight into your website’s overall performance.

Using Google Analytics to find website traffic

The easiest and most thorough way to track website traffic is by using Google Analytics. Simply add the Google Analytics code to your website to begin tracking website traffic as well as hundreds of other important metrics. You will be able to see detailed reports about traffic, where traffic is coming from, and even trends in traffic.

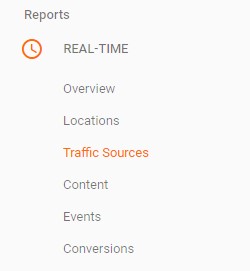
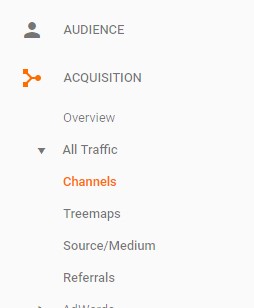
A good report within Google Analytics to look at regarding traffic is the traffic channels report. To navigate to the traffic channels report, click on acquisition and open the all traffic drop down menu. Here, you will find a report labeled “channels.” In this report, you will see your website’s total number of users and total sessions. The sessions number is typically higher than the users metric since some users may engage in multiple sessions on your site.

Looking through the report, you will see that overall traffic is broken down by traffic channels, or the sources of traffic. The main categories that traffic will be broken into are organic search, paid search, direct, referral, social, email, and other. For each traffic channel, you will see metrics such as users, new users, and sessions. This will help you understand where traffic to your site is coming from.


Free Marketing Guide

Discover 7 ways to start marketing your rehab center online.


Traffic segments

Other reports in Google Analytics come in handy when analyzing website traffic. To gain insight about your website visitors, look at the reports under the audience tab in the left-hand menu. Here, you will find reports about demographics, geographic locations, and device usage.

First, start with the demographics report to find information about audience age and gender. Traffic from specific age ranges such as 18-24, 25-34, 35-44, and so on will be found here. Additionally, you will be able to see what percentage of website traffic is male and female. Keep in mind that these numbers may not be 100% accurate since Google does know everyone’s age and gender for certain. Users are grouped into age and gender categories depending on their behavior in relation to the behavior of people who specified their demographic information. While the numbers may be off slightly, this report will still give you a good idea of the demographics of your web traffic.

The location report under the audience tab will tell you where your traffic is coming from geographically. This can be broken down by continent, sub-continent, country, and city. Click through this report to see where your audience is located and where traffic is coming from. For each region, you will be able to see the number of users, new users, sessions, and other metrics.

Under the mobile drop-down menu within the audience tab, there is a report called overview. The mobile overview report is helpful in identifying which devices bring in the most traffic to your site. The three possible device categories include mobile, desktop, and tablet. Again, you will be able to see traffic metrics for each category.

Finally, you can break down traffic by webpage. Not only can you see overall traffic to your site, but you can look at traffic to each specific page. There are several reports that will show this type of information, but one of the most common is the all pages report. To find the all pages report, open the site content drop down menu under the behavior tab. The all pages report will show you each page on your site along with metrics such as page views and entrances. You can use this report to track traffic performance of specific pages or sets of pages on your site, such as a blog.

Website traffic over time

Not only does Google Analytics show you the traffic on your website, but you can view traffic metrics in real time or retrospect. The real-time report will show you how many users are on your site at that exact moment in time. You will see information about which pages website visitors are on, the source of that traffic, and even geographic locations, all in real time.


real time report


The other reports we discussed will show you historical traffic over a certain date range. There is a date range tool in Google Analytics that will let you see traffic metrics for any historical date range. For instance, you could set the date range to show you traffic from January 1, 2017 to December 31, 2017. This will display a whole year’s worth of data. Similarly, you can set the date range to 1 month, a quarter, a week, or any number of days you choose.

There is also the option to compare date ranges. For instance, you could compare date ranges to see website traffic in a year over year view or month over month. Comparing date ranges will help you spot trends in traffic as well as identify changes over time.

Google Analytics can show you even more detailed reports about traffic, but these basic reports will give you incredible insight. Start tracking your website traffic today to better understand how your website is performing.

Get a Free Quote

Don’t let those beds go empty. Start growing your facility with the web today!

Recent Posts

Leave a Comment

This site uses Akismet to reduce spam. Learn how your comment data is processed.